Example 1 (Asymptotes)
Let

What is the domain of  ? What are the roots and
  -intercepts of ? Find the horizontal and vertical asymptotes of .
Solution The domain of is the set on which is defined. As a quotient of continuous functions, is defined when the denominator is not zero:
That is the domain of is  (all the real numbers except -1 and 2. Note now that
 ).
).
The roots of a quotient of continuous functions occur at points in the domain when the numerator is zero:


That is has no (real) roots ( is not a real number).
The -intercept of is the point where cuts the -axis (i.e. when  ):
):
The horizontal asymptotes of are the behaviours of as  :
:
 .
.
Hence  is the horizontal asymptote.
The vertical asymptotes of are the finite  where gets very big (has a singularity). Following our procedure:
Step 1: A quotient of continuous functions can only have a vertical asymptote when the denominator is zero; i.e.  (it is necessary but not sufficient that the denominator is zero – hence Step 2).
Step 2: Evaluate the limits
 and
and 


Step 3: As these limits evaluate to infinity there are vertical asymptotes at  and
and  .
.
Comment To carry out the full analysis of this function to sketch it is quite messy – we need a computer to find the split points of  and
and  .
.
Example 2 (all elements considered)
Let

Find the domain of . Find the roots and -intersections of . Find the horizontal and vertical asymptotes of . Find the intervals where is increasing/ decreasing. Find the locations of the local extrema (local max/min). Find where the function is concave up/ concave down. Hence sketch the graph.
Solution The domain of is where


Domain of is  .
.
The roots of are where

 .
.
The -intercept,  .
.
The horizontal asymptotes
 .
.
Hence the horizontal asymptote  . (Which is a line of slope
  and -intercept
  . (Cf.
  )).
)).
The vertical asymptotes:
Step 1:  .
.
Step 2:

Step 3: Hence is a vertical asymptote.
To find where is increasing/ decreasing, we have to find the split points of (the only place can change sign; i.e. the only place where can go from increasing to decreasing or vice versa . Remember  increasing;
  decreasing. The split points are where
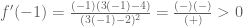
  or undefined). By the quotient rule, is undefined when the denominator is zero; i.e. . By the quotient rule:


The other split points are where , and in this case this occurs when  ; i.e.
  . Now we test in between the split points to see if is positive/negative ( increasing/decreasing). The split points are
  so the intervals to test are:

Choose test points  :
:

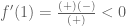

Hence  on
on  and
and  on
on  ; i.e. increasing on and decreasing on .
To find out the locations of the local extrema, we do the following schematic of (If is increasing on an interval draw it increasing, if is decreasing on an interval draw it decreasing. Beware of singularities! At these points is not continuous (like it is at and  )).:
)).:
(please ignore the vertical line joining them up) It is clear from this schematic that there is a local maxima at and a local minima at . These have coordinate  and
and  .
.
To find where is concave up/ concave down we find the split points of . By the quotient rule, as
 ,
,
is undefined at . By the quotient rule:
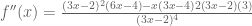
Because we have already considered the case when , we may cancel the  (i.e. dividing by is not troublesome as we have already identified as a split point and hence we will not be dividing by zero):


Hence the only split point of is . Now we test in between the split points to see if is positive/negative ( concave up/ down). The split point is  so the intervals to test are:
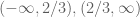
Choose test points  :
:

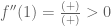
Hence  on
on  and
and  on
on  ; i.e. concave up on on and concave down on .
To sketch the graph take all these points into consideration (click for a sharper image):


Leave a comment
Comments feed for this article