
The Average
The average or the mean of a finite set of numbers is, well, the average. For example, the average of the (multiset of) numbers 

When we have some real-valued variable (a variable with real number values), for example the heights of the students in a class, that we know all about — i.e. we have the data or statistics of the variable — we can define it’s average or mean.
Definition
Let 


The Expected Value
The aim of this note is to explain what the expected value is so I will just give one example of it and then from this write a definition. The expected value refers to the expected value of a real-valued random variable 


Example
Let 


In this case the expected value of
Definition
Suppose that 

Is there a link: Empirical probability vs a priori probabilities
Empirical Probability
We know the statistics of a random variable — we know all the data. Suppose the data is given by 


That is the statistics informs the probability.

A priori Probability
In an a priori (roughly “beforehand”) view of probability we claim that we know the probabilities without knowing any data. Good examples being coin-flipping, dice rolling, card shuffling and lottery games. Using probability we can predict what the statistics will be. For example we know that when coin flipping we will get a head about half of the time.
So in this picture we have that:

In the empirical view we have the average or mean. How does the a priori picture tell us about the average? Well the expected value is a priori’s prediction of what the average will be! For expected value read expected average (i.e. if we take a series of measurements of 

A Justification
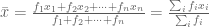
Starting in the empirical picture, let 


Therefore, the average of
Now assign empirical probabilities to 

What about


So, in conclusion, we can think of the expected value of

Leave a comment
Comments feed for this article