
Correlation does not imply causation is a mantra of modern data science. It is probably worthwhile at this point to define the terms correlation, imply, and (harder) causation.
Correlation
For the purposes of this piece, it is sufficient to say that if we measure and record values of variables 


The variables
Causation
Causality is a deep philosophical notion, but, for the purposes of this piece, if there is a relationship between variables
In this case, we write 


If the relationship between

for some constants 


so that there is a causal relation. If this were the case, surely the data should all lie on a straight line and we would have perfect correlation?
The easiest explanation of this is the fact that whenever we make a measurement there is always an error, and so a measurement of 


however this only happens when the fluke 

where 

The usual situation is that, if there is a causal relationship between
Implication
The everyday language implies means something quite different to the logical implies.
The logical implies connects two statements. One statement 

If the statements are 
For example, consider the statements:
We have that 
So, does correlation imply causation? Is it always the case that whenever
There are examples of variables
It is the purpose of this piece to show that such situations are inevitable.
Ramsey Theory
The basic principle of Ramsey Theory (for Data Science) is as follows:
With enough data, order and patterns are inevitable.
Example 1: The Pigeonhole Principle
If objects are being placed into boxes, and the number of objects exceeds the number of boxes, then at least one box contains at least two objexts.
For example, in a school with over 366 students, at least two will share a birthday. Indeed in a school with over 732 students, at least three will share a birthday.
The famous Birthday Problem asks the question:
What is the probability that in a group of
randomly selected people, that two will share a birthday?
In particular, what is the smallest value of
With enough data, patterns are likely. Indeed, with only 

With enough data, patterns are likely: with even more data, patterns are inevitable. If you want to read about likely order and patterns look at e.g. the Texas Sharpshooter Fallacy.
We are talking about inevitable.
Example 2: The Party Problem (Ramsey’s Theorem)
For any numbers
(#mutual friends) and
(#mutual strangers), there is a number
, such that in a party with
Consider the problem with 


We certainly require
If you have four people, you are still not guaranteed three friends or three strangers. For example, suppose you invite two couples to your house, two couples who do not know each other. Suppose you head out just before they come. In this party there is no trio of mutual friends nor mutual strangers.
If you have five people, it is possible that every person knows two people and doesn’t know two people. This can happen. Imagine five people sitting around a table, such that each person doesn’t know the person to their immediate left or right, but does know the two people outside them:

Now with six people. Think of yourself at this party. There are five other people at the party. You could either be friends or strangers with five:

Now because there are five people, either three or more are your friends, or three or more are your strangers: it is impossible that you have two friends and two strangers as there are four people.
Join up you and your (more than) three friends/strangers:

If these three friends (/strangers) are mutual strangers (/friends), they form a group of three mutual strangers (/friends), and so we are done.
If they are not mutual strangers (/friends), then at least a pair of them are mutual friends (/strangers), and so you, and these other two form a group of three mutual friends.
Example 3: Equal Weeks
Consider a random selection of 1025 people who are surveyed one week, Monday to Friday. Asked at the end of the day, “On a continuous scale of 0-10, how did you feel today?”:
- Strongly Positive 7.5 – 10
- Slightly Positive 5 – 7.5
- Slightly Negative 2.5 – 5
- Strongly Negative 0 – 2.5
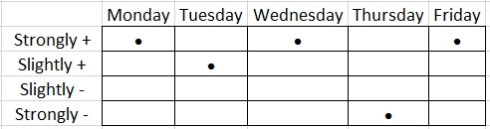
The surveyor looks at all the answers and sees that Mary and John have had a very similar week:

The Pearson correlation coefficient between these two data sets is 0.984: under almost any interpretation this is considered a very high correlation.
Suppose the surveyor gets Mary and John in the room:
- Mary: Yeah I felt great on Monday… bit of a lull on Tuesday but another great day on Wednesday. I had a disaster on Thursday but then Friday was a great day: a great end of the week.
- John: Yes I had exactly the same kind of week… that’s really strange…
Perhaps Mary and John go on to try and rationalise this correlation. What is causing this?
Well, nothing necessarily. There might be a reason but a priori there might be none. If we do something with the data, categorise it, we see that both Mary and John have had exactly the same week on this level:
It isn’t difficult to show that there are 
So while it looks like Mary and John might have had that type of week for some particular reason, in fact, even if all 1025 survey participants answer randomly, it is inevitable that a pair of participants will have weeks that correlate in the sense that they will agree on the broad classification of Positive/Negative; Strong/Slight.
This is why “Big Data” has a Ramsey Problem:
With enough data, order and patterns are inevitable.

Leave a comment
Comments feed for this article