
I am emailing a link of this to everyone on the class list every week. If you are not receiving these emails or want to have them sent to another email address feel free to email me at jpmccarthymaths@gmail.com and I will add you to the mailing list.
Linear Algebra — Test Solutions
More comments on Linear Algebra next week but until then here are the solutions to the test.
Week 12
We spoke about sampling in more detail and also introduced control charts.
Week 13
We will hold a review class on Wednesday 7 May in the usual room. First off, the layout of your exam is the same as Autumn 2013: do question one worth 50/100 and two out of questions two, three, four; each worth 25/100.
I will field any questions ye might have at this time and if there are no questions we will do this exam paper. The best possible thing for your study is to do this exam paper and then on Wednesday see how you got on.
Formulae to Learn?
I spoke about asking Dr. Michael Brennan about putting the confidence interval formula on the exam paper… I just realised this is moot as the exams have already gone for printing. Therefore there are two formulae you will need to know.
The first is the confidence interval for small samples (here I give three presentations):

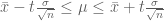
![\left[\bar{x}-t\frac{\sigma}{\sqrt{n}},\bar{x}+t\frac{\sigma}{\sqrt{n}}\right]](https://s0.wp.com/latex.php?latex=%5Cleft%5B%5Cbar%7Bx%7D-t%5Cfrac%7B%5Csigma%7D%7B%5Csqrt%7Bn%7D%7D%2C%5Cbar%7Bx%7D%2Bt%5Cfrac%7B%5Csigma%7D%7B%5Csqrt%7Bn%7D%7D%5Cright%5D&bg=ffffff&fg=545454&s=0&c=20201002)
Here 


The second set of formulae are like confidence intervals for the control charts aka the inner and outer control limits (ICL & OCL). These should be considered versions of the above formula and I will display them as such… the 


ICL: 
OCL:

ICL: 
OCL:

ICL: ![[\bar{\bar{x}}- A_{0.025}\bar{w}, \bar{\bar{x}}+ A_{0.025}\bar{w}]](https://s0.wp.com/latex.php?latex=%5B%5Cbar%7B%5Cbar%7Bx%7D%7D-+A_%7B0.025%7D%5Cbar%7Bw%7D%2C+%5Cbar%7B%5Cbar%7Bx%7D%7D%2B+A_%7B0.025%7D%5Cbar%7Bw%7D%5D&bg=ffffff&fg=545454&s=0&c=20201002)
OCL:
![[\bar{\bar{x}}- A_{0.001}\bar{w}, \bar{\bar{x}}+ A_{0.001}\bar{w}]](https://s0.wp.com/latex.php?latex=%5B%5Cbar%7B%5Cbar%7Bx%7D%7D-+A_%7B0.001%7D%5Cbar%7Bw%7D%2C+%5Cbar%7B%5Cbar%7Bx%7D%7D%2B+A_%7B0.001%7D%5Cbar%7Bw%7D%5D&bg=ffffff&fg=545454&s=0&c=20201002)
Here 
The smaller numbers are the lower limits and the larger numbers are the upper limits.
Independent Learning: Exercices
You are supposed to be working outside of class and I am supposed to help you with this. Working outside of class means doing the exercises in the notes. Any work that is handed up will be corrected by me. Also you can ask me a question here on this site and I will answer it ASAP.
Questions that you can do at this point include:
- P. 130 Q. 1-13
- P.139, Q. 1-7, particularly Q. 1
I wouldn’t necessarily advise looking at ALL of these questions: I would focus on the exam questions over the other questions.
Academic Learning Centre
Those in danger of failing need to use the Academic Learning Centre. As you can see from the timetable there is evening support. You will get best results if you come to the helpers there with specific questions.
Math.Stack Exchange
If you find yourself stuck and for some reason feel unable to ask me the question you could do worse than go to the excellent site math.stackexchange.com. If you are nice and polite, and show due deference to these principles you will find that your questions are answered promptly.
Additional Notes: E-Books
If you look in the module descriptor, you will see there is some suggested reading. Of course I think my notes are perfect but if you can look here, search for ‘Bird Higher Engineering’ you will see that the library have an E-Book resource.

2 comments
Comments feed for this article
May 12, 2014 at 7:13 am
Student
Hi J.P.,
Sorry for bothering you so late. We are struggling with part (c) and (d) of question 1 of the summer 2013 exam. Anyway you could forward on worked solutions to give us a clue as they seem different from the worked example in the book.
Thanks.
May 12, 2014 at 7:33 am
J.P. McCarthy
There is nothing different about these questions at all.
For part (c), let be the number of defective items found.There are
  trials and success is defined as finding a defective item so that the probability of success is
  . Indeed we could write
 ![X\sim\text{Bin}[10,0.03]](https://s0.wp.com/latex.php?latex=X%5Csim%5Ctext%7BBin%7D%5B10%2C0.03%5D&bg=ffffff&fg=545454&s=0&c=20201002) to denote this.
to denote this.
Now for part (i) we are looking for the probability that is less than two (
 here means OR):
I trust that you can finish this question off.
For part (d) (I think this is Q.3 on P.103 so barring silly typos ye have the answers), first you split into those who have the disease and those who do not have the disease (you can use your own notation of course), and
and  with 0.01 on the arrow to
  and the rest of the probability, 0.99, on the arrow to
  .
.
Then each of these split again. A notation I would use is for a positive diagnosis and
  for a negative diagnosis (you can do this using correct/incorrect diagnoses also). Now the
  splits into
  and
and  with respective probabilities 0.97 and 0.03. Similarly the
  splits into
  and
and  with respective probabilities 0.05 and 0.95.
Now part (ii) is looking for![\mathbb{P}[D\,|\,P]](https://s0.wp.com/latex.php?latex=%5Cmathbb%7BP%7D%5BD%5C%2C%7C%5C%2CP%5D&bg=ffffff&fg=545454&s=0&c=20201002) . Now we need the formula for conditional probability. They way I do this is write
. Now we need the formula for conditional probability. They way I do this is write
(the probability of AND
AND  is the probability of
  times the probability of
  given that
  is true).
This implies that
Adapted to our case we have
Now![\mathbb{P}[D\cap P]](https://s0.wp.com/latex.php?latex=%5Cmathbb%7BP%7D%5BD%5Ccap+P%5D&bg=ffffff&fg=545454&s=0&c=20201002) is fairly straightforward: it is equal to (0.01)(0.97). However there are TWO ways of getting a positive diagnosis:
is fairly straightforward: it is equal to (0.01)(0.97). However there are TWO ways of getting a positive diagnosis:
I trust ye can finish this off.
For part (iii) you are looking for the probability of a correct diagnosis; that is and
and  or
or  and
and  :
:
Again I trust that ye can finish this off.
Regards,
J.P.